You’ve got a website. You’ve got digital marketing. And you’ve got data.
But how do you accurately measure the performance of all your digital efforts? You’ll likely need a powerful tool to help you track essential website metrics, including visitors, conversions, engagement, and more. Google Analytics is one of the most beneficial tools businesses can use to monitor their website and online presence. So, let’s dive in.
What is Google Analytics?
Google Analytics is a service offered by Google as a part of the Google Marketing Platform brand. Software Advice states that Google Analytics is “a cloud-based solution designed to help small to midsize businesses track and evaluate website traffic and improve the performance of marketing, content and sales.” This service tracks and reports website traffic and provides data that allows businesses to gain a closer look at the performance of their marketing, website content, products and more. It’s one of the most valuable tools for marketers, advertisers and business owners because it supplies key insights into how visitors use and interact with their website.
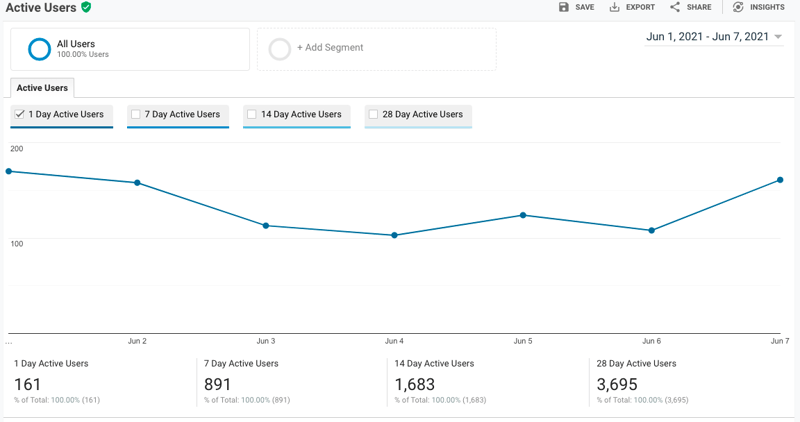
Google Analytics Report
What are the Key Features of Google Analytics?
To put it simply, Google Analytics is a powerhouse with many unique capabilities, tools and features. While there are endless ways to track your website performance, the solution offers several key benefits to help you organize and interpret data.
Analytics Intelligence includes multiple capabilities, including a search option, automated insights, custom reports, and predictive functionality.
- The search feature allows users to type in any questions within Google Analytics and quickly provides helpful answers and guides.
- Automated insights analyze your data and provide insights into significant data changes over time – without the need for manual data entry or reporting.
- Custom insights allow you to control how Google Analytics generates and interprets your data. Create your own sets of rules and receive notifications when the rule conditions are satisfied.
- Lastly, predictive capabilities mean that Google Analytics can predict future users’ actions or behaviors on your website based on your traffic data.
The key capabilities in this category include intelligence and anomaly detection, predictive analysis, app notifications and remote configurations, and audience demographics.
- Intelligence and anomaly detection informs Analytics users of unexpected events or metrics through an easy-to-use diagnostics tool.
- Predictive analysis assists marketers in predicting user actions on their website through Smart Lists and Goals.
- App notifications and remote configurations are sent across other app developer features when marketers create audiences for mobile app users with a tool called Firebase.
- The final component of Data Activation is audience demographics, which gives Analytics users detailed information about the age, gender and interests of their website visitors.
Data analysis and visualization have several components, including data access, filtering and manipulation, funnel analysis, segmentation, visualization and monitoring, and custom funnels and advanced analysis exclusively for Analytics 360 users. This feature is also composed of audience discovery and comparison tools.
- Data access allows users to retrieve their data anywhere at any time, whether it’s through the web or their mobile device.
- Filtering and manipulation capabilities allow marketers to control the way data is filtered. This can be done through advanced filters, custom channel groups, content groups and calculated metrics. This is a key benefit of using Google Analytics. It offers marketers, advertisers, and business professionals the ability to customize their reports to best suit their business’s needs and standards.
- Funnel analysis can be accomplished based on the information the Analytics user needs to make actionable insights. These tools for your website(s) and app(s) include shopping and checkout funnels, app event funnels, multi-channel funnels and custom funnels (for Analytics 360 users only).
- Segmentation gives users the ability to create built-in audiences and custom segments. Users can develop segments at the session or user level and use them within Google Ad campaigns and other Google products to enhance targeting efforts.
- Visualization and monitoring functions are associated with built-in reports and offer the ability to visualize your data in a way that makes the most sense for your organization. Google Analytics users can also construct dashboards and widgets according to their preferences.
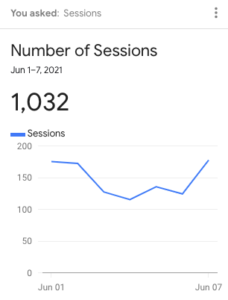
Number of Sessions
- Collection APIs allow you to import interaction data from any internet-connected third-party source. Analytics supports JavaScript libraries, mobile app SDKs and an open-measurement protocol that enables the import to be done.
- Configuration APIs is a collection of APIs that allow users to manage users and account data.
- The Tag Management Support functionality means that Google Analytics seamlessly integrates with Google Tag Manager and Tag Manager 360, and it’s supported by all leading tag management systems.
- Custom variables: if there’s one thing to understand about Google Analytics, it’s that the service allows for user customization in many areas to make the data you receive tailored to your business’s unique needs. Custom variables include custom dimensions, custom metrics and calculated metrics.
- The data import component helps the Analytics user to gain a better understanding of all the data they’re collecting about their website by allowing them to import data from external sources and applications into Analytics.
- User access controls is a beneficial feature if multiple users are accessing your Analytics account. It allows for the primary user to control the permissions of other employees within the same account.
- Custom tables and Google BigQuery Export are two additional data collection & management tools; however, they are only available to Analytics 360 users.
Some integrations are only accessible to Analytics 360 users, but there are still a handful of efficient integrations available to use.
- Google Ads is one of the most popular integrations, providing Analytics users the ability to see their ad performance statistics alongside their website analytics. Users can also import their Analytics goals, e-commerce transactions and metrics into their ads account.
- Gain a more comprehensive view of your ad performance by connecting your Google AdSense account to Analytics.
- Data Studio reports can be modified by Analytics segments for users to see how their data is being stored and sampled.
- Make your site that much better through Optimize 360, a feature that enables users to create custom site experiences using audiences they’ve already created in Analytics.
- Use Surveys 360 to send surveys to audiences created in Google Analytics.
- Salesforce Marketing Cloud Integration enables users to see Analytics data in the Marketing Cloud.
- With Google Search Console, data becomes visible within Analytics. This is done when users connect their Analytics account with a site in their Search Console account.
- Display & Video 360, Search Ads 360, Google Cloud and Google Ad Manager are functionalities that are only usable to Analytics 360 users.
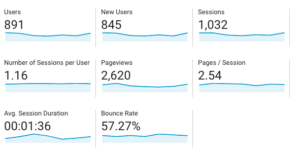
Google Analytics Reporting Dashboard
- Audience reports give marketers the ability to develop a deeper understanding of their audience through measuring factors such as the active users on your site or app and the lifetime value of those users.
- Advertising reports help marketers, advertisers and business professionals better understand the performance of their online advertising efforts and opportunities for improvement.
- Acquisition reports help marketers analyze how they acquire site visitors and the sources, mediums and campaigns through which they were received. Marketers can also see how site visitors behave on the site and their overall conversion patterns.
- Behavior reports are an efficient way to truly see how visitors are interact with your website and the actions they are taking on it.
- Conversion reports ensure that business professionals have all the information they need about how conversions are gathered on their websites and apps. Review the exact path users took leading up to their conversions, their purchase activity and more.
- Real-time reporting is exactly what it sounds like. Analytics users can observe the activity and performance of their website at any moment during the day.
- User flow reporting showcases the path users take across a business’s websites. Gain insight into groups of pages and the actions of a specific user with this functionality.
- Data Freshness, Unsampled Reports and Roll-Up Reporting are all additional reporting capabilities that are only available to Analytics 360 customers.
What Goals Are Available in Google Analytics?
While there are many valuable features in Google Analytics, goal tracking may be the most important for businesses. Google defines a goal as “a completed activity, called a conversion, that contributes to the success of your business.” There are four different types of goals within Google Analytics.
Types of Google Analytics Goals
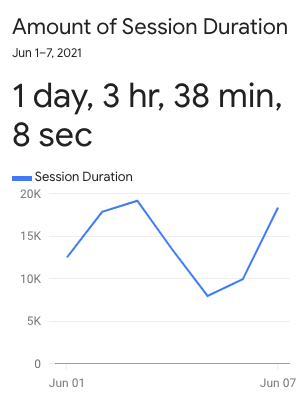
Session Duration of a Website Visitor
- URL Destination Goals – These goals allow you to track page visitors on a specific URL. We commonly use this option to track “Thank You” page views to identify those who have submitted a form or made a purchase. URL Destination Goals treat a pageview or screen view as a conversion.
- Visit Duration Goals – This metric tracks how many people visit your site and for how long. For example, you may consider a visitor who scrolls on a webpage for more than 30 seconds a goal.
- Pages/Screen Per Session Goals – Goals of this type track the number of pages each visitor travels to as a measurement of engagement. Visitors that go to more pages than specified will be classified as a conversion.
- Event Goals – Event goals track elements such as downloads, form submissions and widget use and consider these interactions as conversions.
How do I Create Goals?
If you’re ready to dive into creating goals, the steps are fairly simple.
- To set up goals, navigate to the Google Analytics Standard Reports.
- From there, click Admin, Goals, and then the “+ Goal” button.
- Then, all you need to do is name your goal and select whether you want it to be active (actively tracking) or inactive (turned off and not tracking).
As you generate new goals, keep in mind that you can’t delete them; you can only mark them as inactive.
What is the Pricing for Google Analytics?
The good news is that consumers can use a free version of Google Analytics to track their website performance metrics. However, Google does offer a paid version of this service called Analytics 360, which includes exclusive features as we mentioned above. While most website performance services offer limited free features, the free version of Google Analytics is perfect for small to medium-sized companies. However, larger enterprise companies will likely need to upgrade to Analytics 360. This version starts at $150,000 per year, billed monthly, and it features advanced funnel reporting and attribution modeling, roll-up reporting, more views, dimensions and metrics per property, unlimited and unsampled data and dedicated support with an account manager.
Before deciding whether to purchase Analytics 360, spend some time testing out all the features available in the free version. We recommend not immediately investing in Analytics 360 until you’re sure it suits your business’s needs.
Get Started with Google Analytics.
Google Analytics is an extensive service that will help take your business, marketing and advertising efforts to the next level. There are endless opportunities for customization that will equip you with the most valuable insights for your business. For more information about an important website metric to track, read our blog article Direct Traffic & What It Means for Your Business.
Explore our suite of services and how they can enhance your business. Contact us today to learn more!